Charts Editor
When you add the component Chart in the report template, the chart editor is called. This editor is used to create the chart: defining the types of rows, data sources, styles, and other settings. A chart can be created using the wizard or manually. Below is a diagram editor.
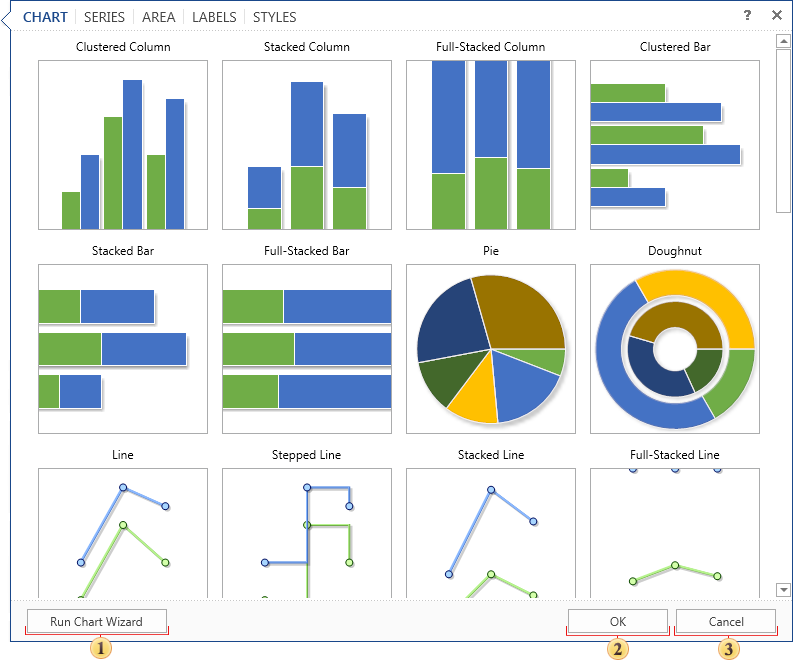
 The button Run Chart Wizard.
 When you press this button, a chart of a certain type with the specified parameters is created.
 Pressing this button cancels the creation of a chart but the component remains is the report template.
As can be seen from the picture above, the chart editor contains the following tabs:
-
Chart. Defined the Chart type;
-
Series. Defines the parameters of the series;
-
Area. Sets areas with axes;
-
Labels. Sets chart labels;
-
Styles. Sets the style for the chart.