Dashboard with Top N
When creating reports you can apply the TopN filter to the following elements: Chart, Indicator, Progress, Pivot table.
The following questions will be considered in this chapter:
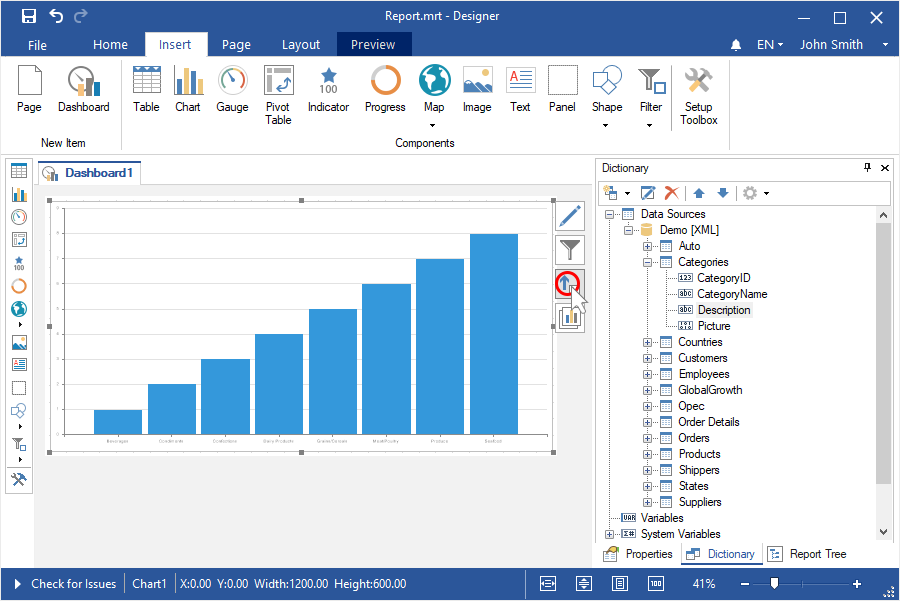
Chart
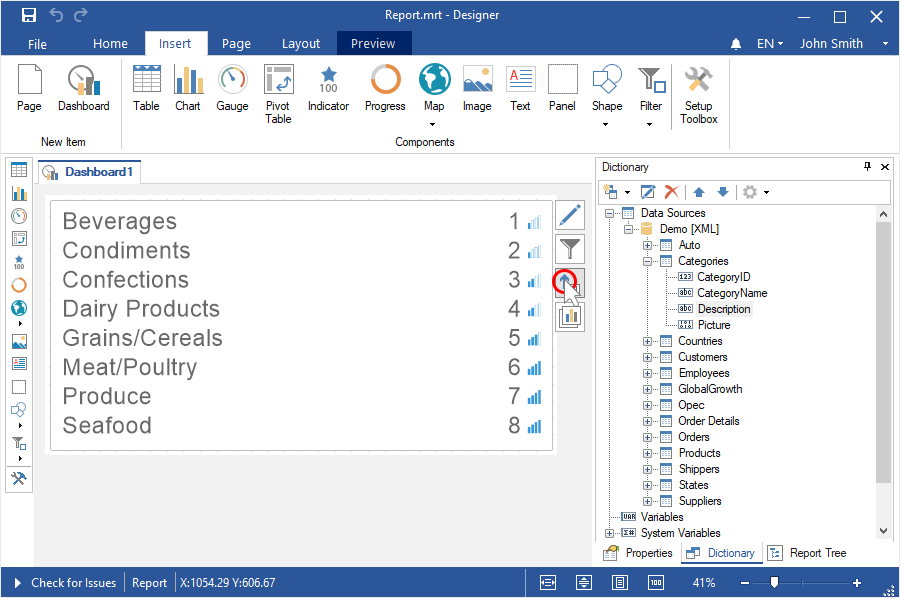
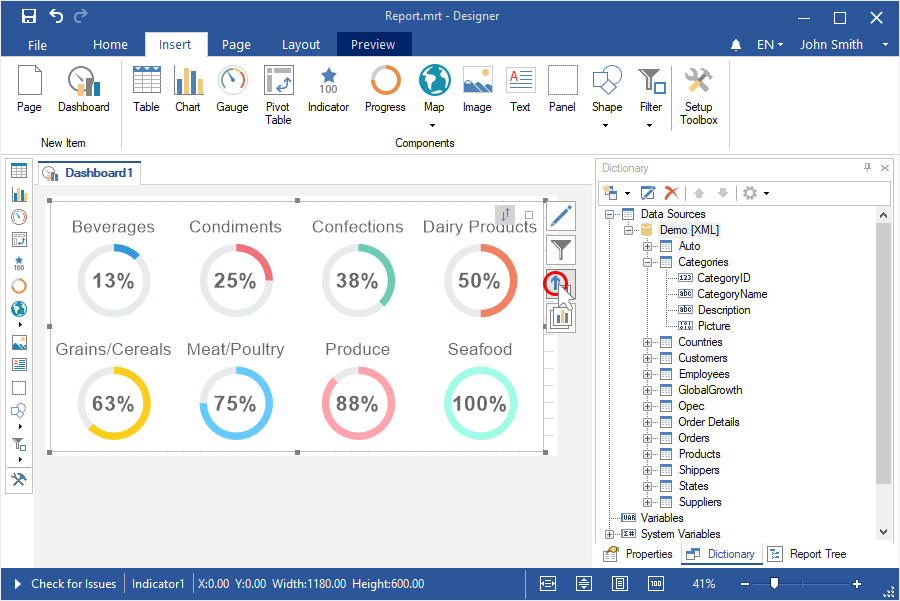
Step 1: Create a dashboard with the Chart element;
Step 2: Select the element;
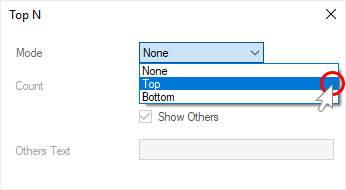
Step 3: Click the TopN button of the current element;
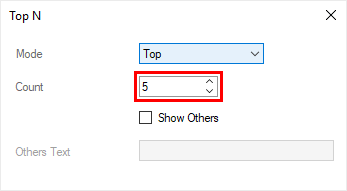
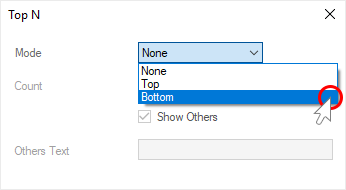
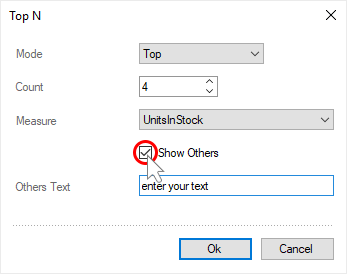
Step 4: Select Top or Bottom mode in the TopN editor;
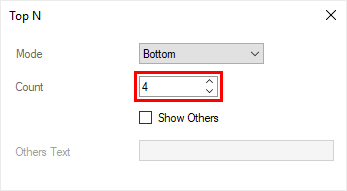
Step 5: Set the number of the TopN with the help of the Count parameter;
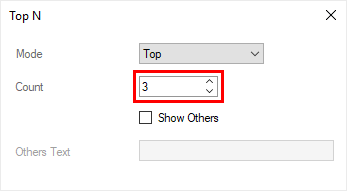
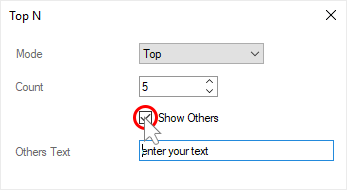
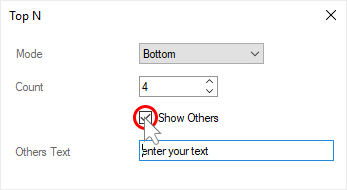
Step 6: Set a checkbox for the Show Other parameter, if you need to sum all values, which will not be included in the list of the TopN and display them as one value;
Step 7: Specify a header for other values in the Other text field, if it`s needed.

Step 8: Close the editor of the TopN;
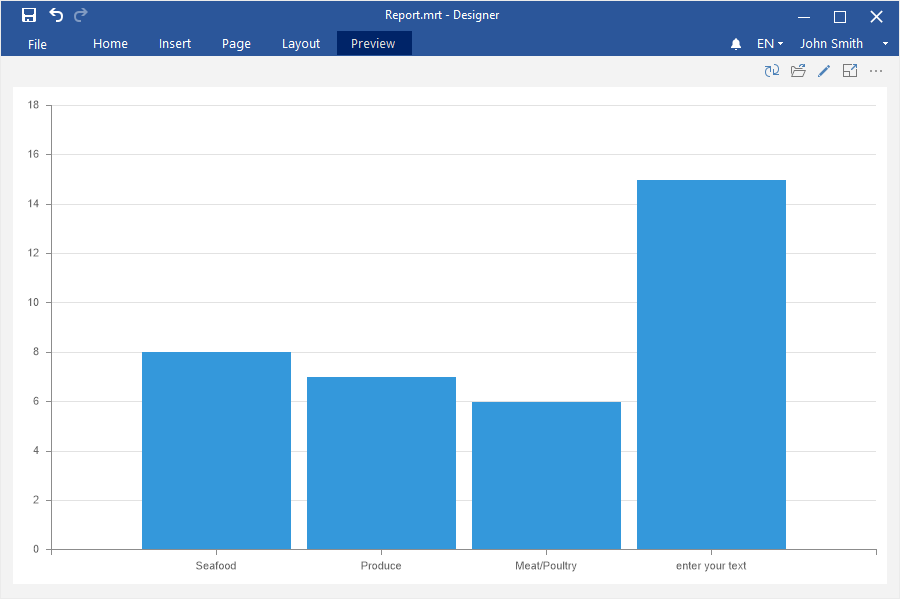
Step 9: Go to the Preview.
Indicator
Step 1: Create a dashboard with the Indicator element and its rows;
Step 2: Select the element;
Step 3: Click the TopN button of the current element;
Step 4: Select Top or Bottom mode in the TopN editor;

Step 5: Set the number of the TopN with the help of the Count parameter;
Step 6: Set a checkbox for the Show Other parameter if you need to sum all values, which will not be included in the list of the TopN and display them as one value;
Step 7: Specify a header for other values in the Other text field, if it`s needed. The Other header is applied to them by default.
Step 8: Close the TopN editor;
Step 9: Go to the Preview tab.
Progress
Step 1: Create a dashboard with the Progress element and its rows;
Step 2: Select the element;
Step 3: Click the TopN button of the current element;
Step 4: Select Top and Bottom mode in the TopN editor;
Step 5: Set the number of the TopN with the help of the Count parameter;
Step 6: Set a checkbox for the Show Other parameter if you need to sum all values, which will not be included in the list of the TopN and display them as one value;
Step 7: Specify a header for other values in the Other text field, if it`s needed. The Other header is applied for them, by default.
Step 8: Close the TopN editor;
Step 9: Go to the Preview tab.
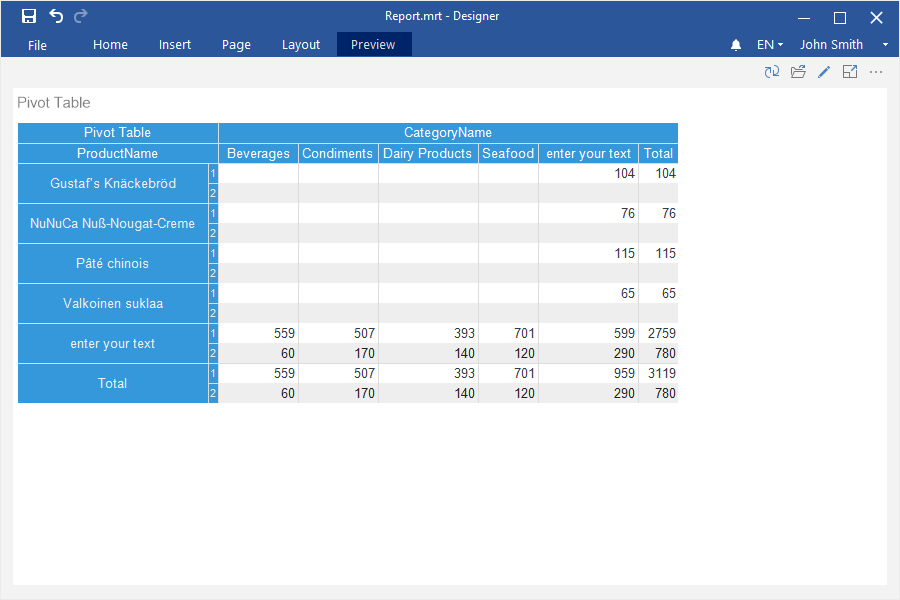
Pivot
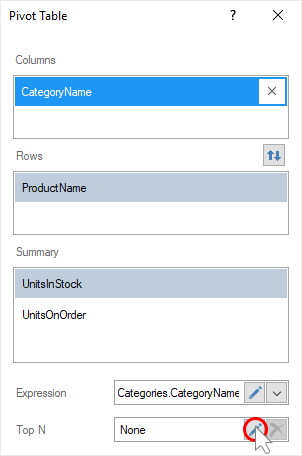
Step 1: Create a dashboard with the Pivot table element;
Step 2: If the editor element is not displayed, you should double click on the Pivot table;
Step 3: Select the data columns for which you need to display the TopN in the Rows or Columns field;
Step 4: Click the TopN of the current element;
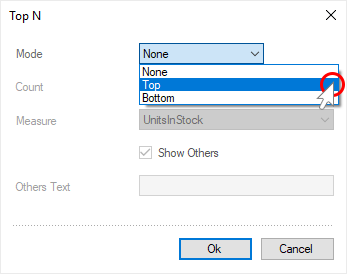
Step 5: Select Top or Bottom mode in the TopN editor;
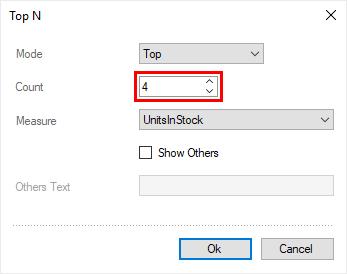
Step 6: Set the number of the TopN with the help of the Count parameter;
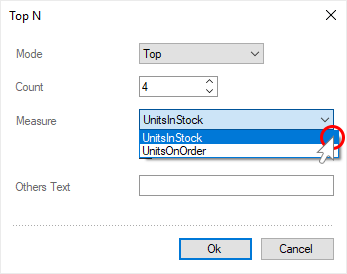
Step 7: Select the summary field, which values will be analyzed in the field of the Measure parameter;
Step 8: Set a checkbox for the Show Other parameter, if you need to sum all values, which will not be in the list of the TopN and display them as one value;
Step 9: Specify a header for other values in the Other text field, if it`s needed. The Other header is applied for them, by default.
Step 10: Close the TopN editor.
Step 11: Close the Pivot table editor;
Step 12: Go to the Preview tab.