Marker
A Marker is a graphical symbol used to display series values on a chart. Markers are available only for line-based charts, including Line, Area, Range, Scatter, Radar, and their variations.
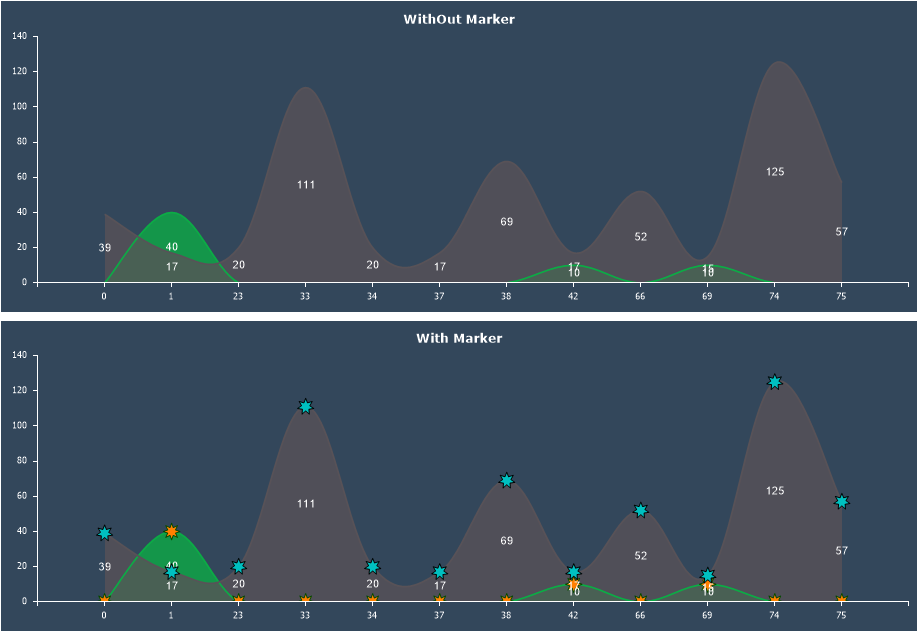
To apply a marker to a chart series, follow these steps:
- In the component editor, go to the Series tab and open the Marker section;
- Configure the marker’s appearance using its properties.
Information
If a style is applied to the chart, the marker’s appearance settings will be inherited from that style. Before customizing the marker in the Marker tab, set the Allow Apply Style property to False in the Common tab.
Below is a table of properties that are used to configure the marker.
| Name | Description |
|---|---|
| Border Color | Allows you to change the marker’s border color. |
| Brush | Allows you to change the brush type and the fill color of the marker. |
| Angle | Allows you to rotate the marker by a specific angle. The value can be positive or negative, representing the rotation angle in degrees. A positive value rotates the marker to the right, while a negative value rotates it to the left. |
| Size | Defines the marker’s size in pixels. |
| Type | Allows you to select the marker’s geometric shape: rectangle, triangle, circle, star, hexagon. |
| Visible | Enables or disables the display of the marker on the chart. If set to True, the marker will be visible. If set to False, the marker will not be displayed. |