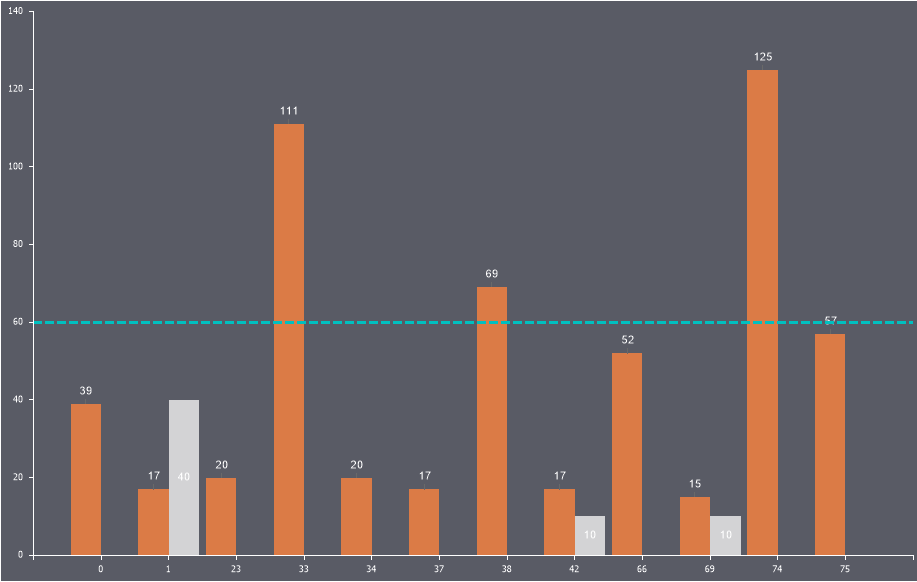
Constant Lines
Constant Lines are horizontal or vertical lines on a chart that represent a specific value on the axis.
To add a constant line:
- In the component editor, go to the Chart tab and select the Constant Lines sub-tab;
- Click the Add Constant Line button;
- Configure the line using the available properties.
Information
The number of constant lines on a chart is unlimited.
Below is a table of properties for configuring constant lines:
| Name | Description |
|---|---|
| Allow Apply Style | Enables applying design settings for the constant line from the chart style. If set to True, the line design will inherit the selected chart style. If set to False, additional properties will appear for customizing the line’s appearance, such as line color, smoothing, font type, size, and family. |
| Axis Valu | Specifies the axis value through which the line is drawn. |
| Line Style | Allows changing the style of the constant line. |
| Line Width | Defines the width of the constant line in pixels. |
| Orientation | Allows selecting the line’s orientation: Horizontal, Vertical, or Horizontal Right. |
| Position | Specifies the position of the constant line’s text. |
| Show Behind | Determines whether the constant line is displayed behind or in front of the chart’s graphic elements. If set to True, the line will appear behind the elements. If set to False, it will appear on top of the graphic elements. |
| Text | Allows defining the text for the constant line. |
| Title Visible | Toggles the visibility of the constant line’s text. If set to True, the text will be displayed. If set to False, the text will not appear. |
| Visible | Toggles the visibility of the constant line. If set to True, the constant line will be displayed on the chart. If set to False, it will not appear. |